
|
|
|---|
Research Results and Discussion
Discussions must be relevant, critical, and supported by published evidence. The results of research and discussion can be written in the same or different sub-chapters as needed. Results are presented in the form of tables or figures/graphs, with a maximum of 6 (six) tables and figures.
- Table
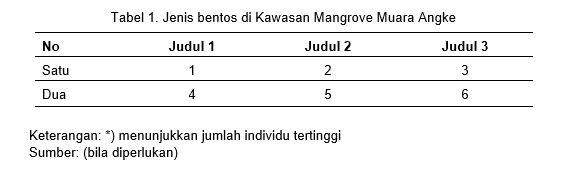
Tables are arranged and numbered sequentially according to their occurrence in the text. Each table should be given a brief and clear title that is placed at the top of the table at the top center position, size 10 pt. The contents of the table are written in one space with a size of 10 pt (see Table example). Information or symbols in the table (if any) are placed at the bottom of the table with one space and a font size of 10 pt. Attach the table in a separate file. Each table displayed must be cited in the text.
Example table:
- Picture
The displayed image must be in good quality and resolution. Images or illustrations taken from other sources must be referenced. Images must be numbered in the order they appear in the text. Each image must be given a brief and clear description of the image placed at the bottom of the image, center, one space with a size of 10 pt. (see sample image). Attach the image in a separate file in JPG format. Each image displayed must be cited in the text.

Gambar 1. Struktur Buah Manilkara Zapota
.png)
4.png)